
|
International Futures Research |
The 161 point price rally on Tuesday April 3 violated a three point downsloping trendline on the daily June Euro-fx futures chart. This changed the direction of the short term price trend from down to neutral. Per last week's research, CHARTWATCH believed that this was the bar charting signal necessary to establish a new long.
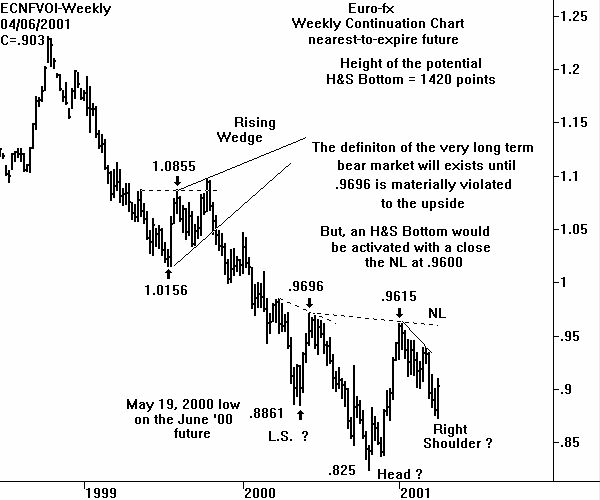
A signal of much longer term importance is the posting of an Outside Range Week. This weekly chart has been included again. Regular readers of CHARTWATCH's Euro-fx research are well aware of the H&S Bottom possibilities on the weekly chart. The posting of this minor' trend change indicator could be signaling the low of the right shoulder. The minimum upside measuring objective of the Outside Range Week is to take out the current week's high of .9094 on the June future.
Back to the daily chart. Note that a dashed line has been drawn on the June futures chart beginning at the March 21 high (.9128). This is the convention CHARTWATCH uses for a neckline. Admittedly, the right shoulder is not very developed'. In fact it is only one day - Friday's Inside Range Day. Some slight downward price pressure to start the new trading week would be ideal. Then a high volume (22,000+) close above .9094 would activate the pattern.
The vertical height of the possible H&S Bottom is 367 points. A close above .9094 would be forecasting another 367 points - up to .9461.
Note that .9461 is not above the neckline on the weekly chart. But don't forget, any H&S objective is only a minimum. And there will not be any overhead resistance on the chart.
The bottom line is that enough technical evidence is present to be long the June Euro now. But traders must be able to withstand a price selloff that forms a better right shoulder on the daily chart.
For traders not long, a purchase of the June Euro at .8916 would be ideal. A protective sell-stop on all longs will be placed at .8848.

Monthly Euro chart
Implied Volatility Charts (Thru Feb 5, 2001)
Return to Sample Research Reports
| Home | Weekly Research Reports | Audio Market Update | Technical Analysis Video Tapes | Technical Analysis Books | Technical Analysis Courses |