|
International Futures Research |
One week ago, the technical condition of the daily, weekly, and monthly Gold chart was that price was attacking' an important price low.
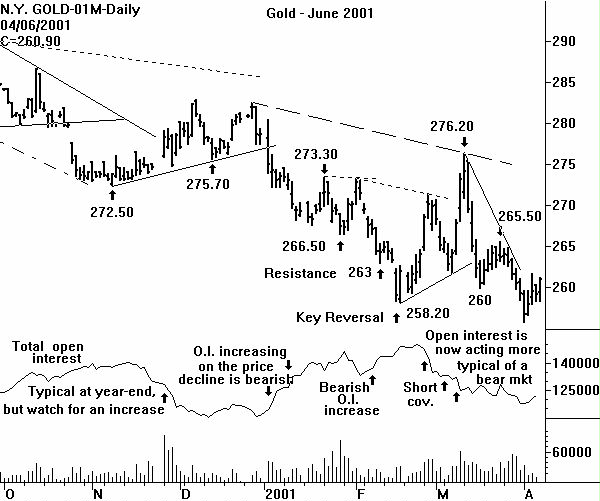
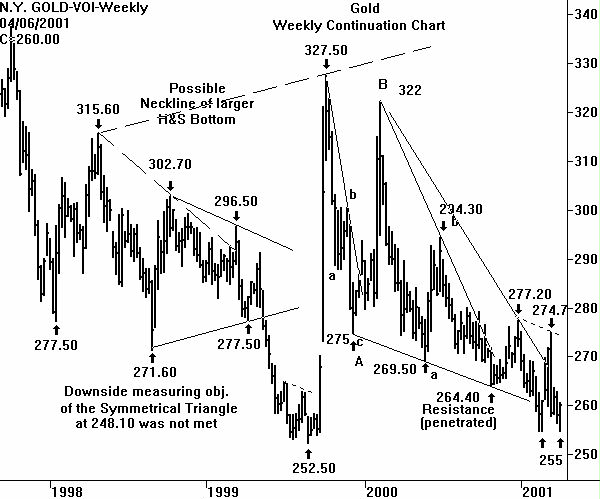
On the daily June Gold chart, a new price low (below 258.20) was registered. But on the weekly continuation chart, the February 23 weekly low of 255 was exactly equaled with the low in the spot April future at 255. On the monthly continuation chart, the 252.50 low, set in August of 1999 was not violated (with the 255 monthly low, so far, in April).
Although CHARTWATCH would like to be bullish on Gold, a trader should not jump to the conclusion that a Double Bottom is forming on the weekly chart. It would take a high volume close above 274.70 (on the spot April Gold ) before a Double Bottom would be an active price formation.
There are several bullish factors present on the daily June Gold chart. But neither automatically forecast that a Double Bottom will be set off. First, Friday's late session price strength took the June Gold into overhead resistance at the 260.00 level. This also happened the two previous trading sessions, but Friday was the first close above 260.00. Second, open interest is no longer moving in lock step with the bears. On the price break on Friday March 30 and Monday April 2, total open interest in Gold futures declined. On the price up days of April 3 and 4, open interest expanded.
CHARTWATCH has not included a chart of a Gold stock. But these charts, Barrick Gold, Homestake Mining, Newmont Mining, actually all show better long term bottoming tendencies than the price of bullion itself. Perhaps some of this is (finally) due to a flight from the (really bearish) equity market. If so, the possibility of bearish triangles on the S&P 500 and Dow charts will continue to help the Gold bulls. But this is a fundamental point. A chartist should try not to be influenced by the supposed fundamental' picture.
CHARTWATCH is reluctant to recommend a new long in Gold simply because a near-by resistance level has been penetrated and open interest is not acting bearish. But there is nothing on the daily chart to stop a small run to the upside to the benchmark high price of 265.50 on the June future.
Monthly Gold Chart
Selected Gold Futures Implied Volatility Charts (Thru March 6, 2001)
Return to Sample Research Reports
| Home | Weekly Research Reports | Audio Market Update | Technical Analysis Video Tapes | Technical Analysis Books | Technical Analysis Courses |